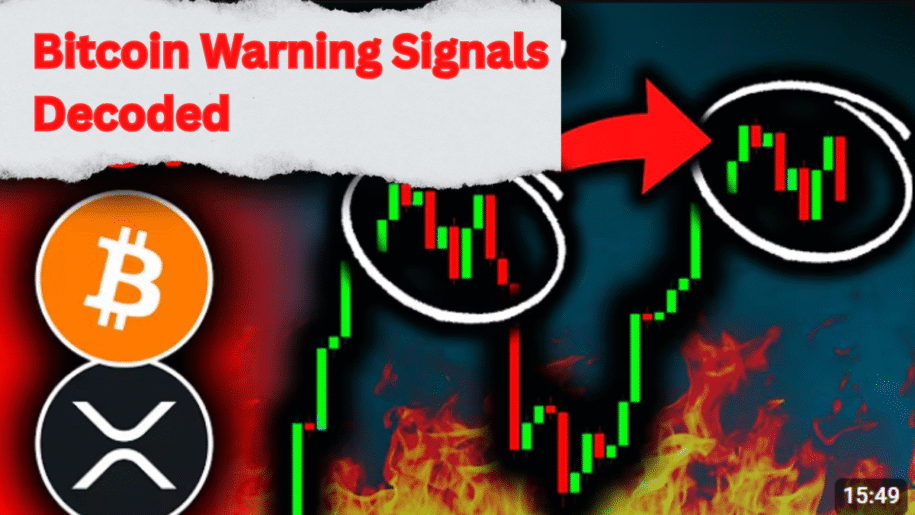
Understanding the Warning Sign
Bitcoin, the undisputed pioneer of the cryptocurrency world, is yet again under the scanner. This time, the spotlight is on bearish signals that have emerged in prominent charts and indicators. While the market has mostly been basking in optimism, these warnings force us to take a measured and analytical approach.
Could these signals foreshadow a pause in Bitcoin’s monumental rally? Or are they merely part of the natural ebb and flow of financial markets? One thing is clear—this is a pivotal moment for investors, traders, and enthusiasts alike. If you’re wondering how to react to these developments, this analysis is for you.
Deep-Dive Into the Warning Indicators
1. The Bearish MACD Signal — What It Means
The Moving Average Convergence Divergence (MACD) is trusted for spotting market trends. On Bitcoin’s 3-day chart, a bearish crossover signal has appeared. Here’s what makes it significant:
- The 3-day bearish crossover occurs when the MACD line crosses below the signal line. This usually indicates a shift in momentum from bullish to bearish.
- Historically, these signals have been precursors to short-term corrections or cooling off from rapid price gains.
Historical Context of Bearish Crossovers
| Date | Result |
|---|---|
| January 2025 | 15% correction |
| April 2024 | 10% pullback |
Events like these don’t necessarily signal the end of a bull market but do warn investors of upcoming price consolidation. This brings us to the present—could this signal be another pause or the start of something larger?
2. RSI Divergence—A Subtle but Powerful Signal
One of the most eye-catching red flags on Bitcoin’s weekly chart is the bearish divergence in the Relative Strength Index (RSI). This divergence is formed when the RSI hits lower highs, while Bitcoin’s price chart displays higher highs.
Such patterns often act as early alarms for investors. While the price moves up, weakness in the RSI suggests that the bullish momentum might be losing strength. This is particularly critical now because:
- The last comparable divergence led to a multi-week correction earlier this year.
- Lower highs in RSI typically precede shifts toward bearish trends as buying interest dwindles.
💡 Key Takeaway: Investors should consider this a moment to carefully assess whether additional investments are backed by strong fundamentals.
3. Support vs. Resistance Levels—A Game of Numbers
Bitcoin’s movements over the short term will likely range between key support and resistance zones:
- Support levels:
- $101,000–$102,000
- $96,000–$98,000
- Resistance levels:
- $110,000–$112,000
- $118,000 (tested previously)
What makes these levels critical is the way Bitcoin reacts to them. A break below $101,000 could trigger a much sharper drop, while breaking resistance above $112,000 may reignite bullish fervor.
| Range Type | Price Zone |
|---|---|
| Support | $101,000 to $102,000 |
| Resistance | $110,000 to $112,000 |
Ripple Effects on Altcoins
Bitcoin doesn’t exist in isolation. Its market performance reverberates across the entire crypto ecosystem, affecting major altcoins like Ethereum (ETH), Solana (SOL), XRP, and Chainlink (LINK). These assets often mirror Bitcoin’s trends, albeit with their distinct variations.
Ethereum—Can It Break Free?
Ethereum, the second-largest cryptocurrency by market cap, faces its own set of challenges:
- Current resistance levels sit firmly at $2.7K-$2.8K. Ethereum’s price has struggled to break above this range despite testing it multiple times.
- Bearish divergence in the Ethereum RSI further complicates the outlook.
Should Ethereum lose support at $2.4K, traders could see prices fall as low as $2.1K, paving the way for sharper corrections.
Solana—Critical Pivotal Levels
Solana (SOL) recently made headlines for its strong rally but now finds itself at a crossroads:
- It hovers near support levels of $143–$146.
- If breached, this could lead to a downward move towards $124 or even lower.
Interestingly, if we see a bounce at these levels, it might form a bullish W-pattern, offering Solana a potential revival opportunity.
Chainlink—Testing Patience
Like Ethereum and Solana, Chainlink (LINK) is not immune to the broader market sentiment:
- Current major support at $12.80 has, so far, held firm.
- A failure to sustain above this level could drag LINK prices to $11.20 or lower.
What’s worth noting here is the close psychological synchronization between Chainlink holders and overall confidence in the crypto sector. The moment Bitcoin rallies again, LINK could recoup its losses sharply.
What Should Investors Do?
At this juncture, it’s essential to take a careful, measured approach rather than reacting emotionally to these signals. Here are some points of consideration:
- Understand Market Dynamics:
- Technical indicators like MACD and RSI aren’t standalone explanations for Bitcoin’s movements. They need to be supplemented with on-chain data, market sentiment, and macroeconomic conditions.
- Don’t Panic During Corrections:
- Corrections are not crashes. They are an opportunity to reflect, strategize, and even add to holdings at lower valuations.
- Diversification Is Your Friend:
- Allocating assets across cryptocurrencies and other financial instruments can reduce the emotional and financial impact of turbulence.
- Stay Updated:
- Markets evolve rapidly. Following influential voices and reliable news sources is invaluable in spotting shifts as they happen.
Final Thoughts
The current bearish flags on Bitcoin charts are stark reminders of the importance of staying vigilant in the volatile world of cryptocurrencies. Key metrics like the 3-day MACD bearish crossover and RSI divergences offer plenty of food for thought, but they’re not definitive prophecies. They simply light the way for more informed and strategic decisions.


